

 [[{“value”:”
In an era defined by the push toward clean energy, electrification, and advanced technologies, critical minerals have emerged as the backbone of modern manufacturing and national security. These essential resources—ranging from lithium for batteries to rare earth elements for magnets—are vital for everything from electric vehicles (EVs) to renewable energy infrastructure and defense systems.
However, the United States faces significant vulnerabilities in its supply chains, with heavy reliance on foreign sources, particularly China, which dominates global production and refining. As of October 2025, the U.S. Geological Survey (USGS) has released a draft list of 54 critical minerals, expanding from the 2022 list of 50 by adding commodities like copper, silicon, potash, silver, rhenium, and lead while removing arsenic and tellurium.
Got Questions on investing in oil and gas? Or do you have a Tax Burden in 2025?
This article examines the top 15 critical minerals most relevant to the U.S. energy transition and manufacturing, their global sources, refining capacities, and production of usable materials. It also assesses China’s control, U.S. progress in securing supplies, and the path to independence.
Why Critical Minerals Matter
Critical minerals are defined by their economic importance and high risk of supply disruptions, as per the Energy Act of 2020, which mandates USGS updates every three years.
For the energy sector, minerals like lithium, cobalt, nickel, graphite, and rare earth elements are indispensable for batteries, wind turbines, and solar panels. The International Energy Agency (IEA) highlights that demand for these could quadruple by 2040 under net-zero scenarios, driven by the global shift to clean energy.
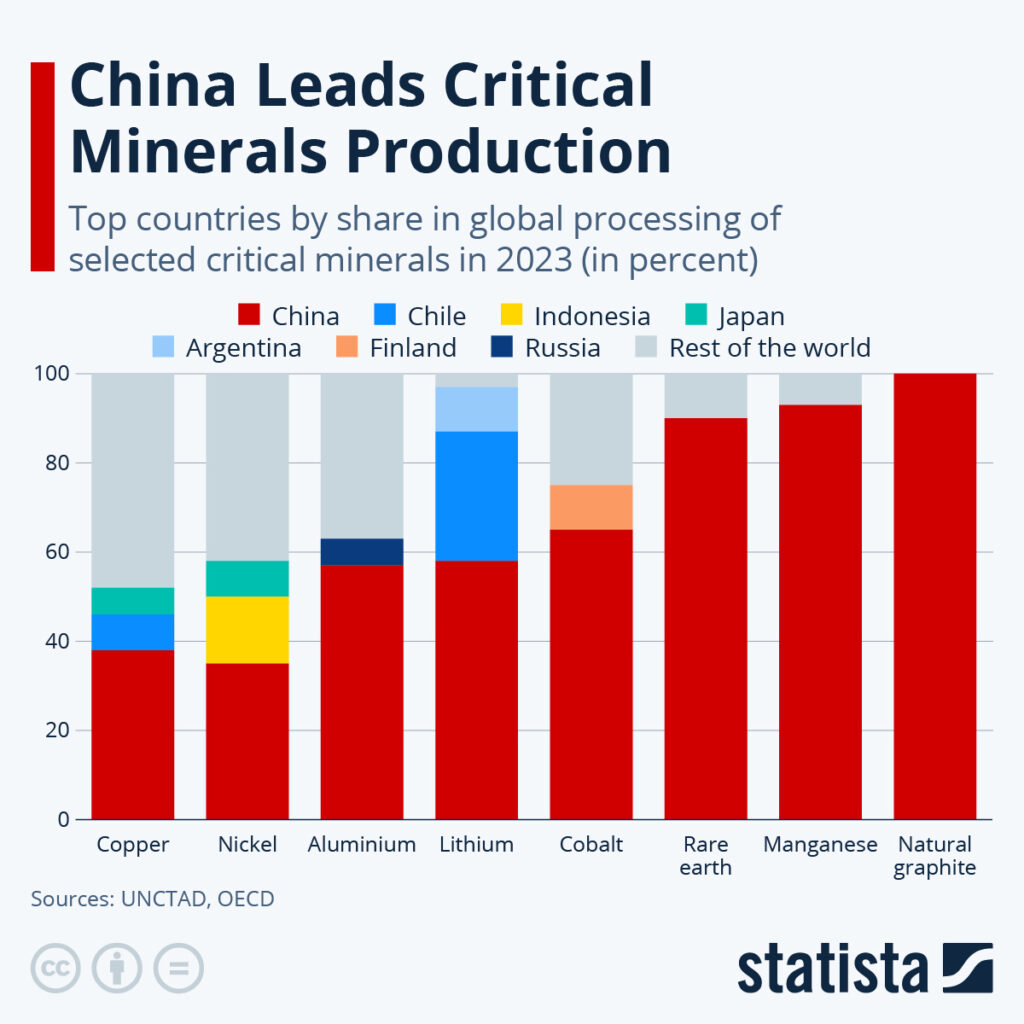
Yet, concentrated supply chains pose risks: geopolitical tensions, export restrictions, and environmental challenges can lead to price volatility and shortages. China’s dominance in processing—often exceeding 70-90% for key minerals—amplifies these concerns, especially amid recent export curbs on rare earth technologies and elements like gallium and germanium.
Top 15 Critical Minerals: Sources, Refining, and Usable MaterialsBased on USGS and Department of Energy (DOE) assessments, as well as IEA reports, the following table summarizes the top 15 critical minerals prioritized for the U.S. energy transition. Selection focuses on those with high import reliance, supply risks, and relevance to clean tech. Data includes primary global sources (mining), refining capacity shares, and processes for creating usable materials (e.g., metals, compounds, or alloys for manufacturing). China’s control is quantified where possible, alongside U.S. domestic or secured shares.
|
Mineral
|
Key Uses in Manufacturing
|
Primary Sources (Mining)
|
Refining Capacity (Global Shares)
|
Creation of Usable Materials
|
China’s Control (%)
|
U.S. Secured/Share (%)
|
|---|---|---|---|---|---|---|
|
Lithium
|
EV batteries, energy storage
|
Australia (50%), Chile (30%), China (10%)
|
China (60-70%), Australia/Chile (20-30%)
|
Extracted as brine/carbonate, refined to hydroxide/carbonate for cathodes
|
60-70% refining
|
~5% domestic (Nevada projects); imports 100% net reliance |
|
Cobalt
|
Battery cathodes, alloys
|
DRC (70%), Australia (5%), Indonesia (5%)
|
China (70%), Finland/Belgium (15-20%)
|
Refined to sulfate/metal for battery precursors
|
70% refining
|
<5% domestic; ~20% via allies (e.g., Australia) |
|
Nickel
|
Battery cathodes, stainless steel
|
Indonesia (50%), Philippines (15%), Russia (10%)
|
China (35-40%), Indonesia (20-25%)
|
Smelted to matte/sulfate for NMC batteries
|
35-40% refining
|
~10% domestic; high import from Canada/Indonesia |
|
Graphite
|
Battery anodes, lubricants
|
China (80%), Brazil/Mozambique (10%)
|
China (90%), synthetic from U.S./Europe (5-10%)
|
Processed to spherical graphite for anodes
|
80-90% mining/processing
|
0% domestic mining; 100% import reliance |
|
Rare Earth Elements (group)
|
Magnets for EVs/wind turbines, electronics
|
China (60%), Australia (15%), Myanmar (10%)
|
China (90%), Malaysia/Australia (5-10%)
|
Separated into oxides/metals for neodymium magnets
|
60% mining, 90% processing
|
~5% domestic (Mountain Pass); ~15% via allies |
|
Copper
|
Wiring, motors, renewables
|
Chile (30%), Peru (10%), China (10%)
|
China (40%), Chile/Japan (20-25%)
|
Smelted to cathodes for wire/foil
|
40% refining
|
~15% domestic; net exporter of ore but importer of refined |
|
Manganese
|
Battery cathodes, steel
|
South Africa (35%), Gabon (20%), Australia (15%)
|
China (80%), South Africa (10%)
|
Ferromanganese alloys for steel/batteries
|
80% processing
|
0% domestic; 100% import |
|
Gallium
|
Semiconductors, LEDs
|
China (95%), Germany/Japan (minimal)
|
China (95%)
|
Refined from bauxite to arsenide for chips
|
95% production
|
0% domestic; 100% import |
|
Germanium
|
Fiber optics, solar cells
|
China (60%), Russia (20%)
|
China (80%)
|
Refined to dioxide for optics/semiconductors
|
80% processing
|
Minimal domestic; high reliance brookings.edu
|
|
Indium
|
Solar panels, screens
|
China (50%), South Korea (20%)
|
China (60%)
|
Refined to oxide for ITO coatings
|
60% processing
|
0% domestic crossdockinsights.com
|
|
Tantalum
|
Capacitors, alloys
|
DRC/Rwanda (50%), Brazil (20%)
|
China (40%), Estonia/Germany (30%)
|
Refined to powder for electronics
|
40% processing
|
Minimal; recycling efforts crossdockinsights.com
|
|
Tungsten
|
Alloys, electronics
|
China (80%), Vietnam (5%)
|
China (85%)
|
Refined to carbide for tools
|
85% production
|
~10% domestic brookings.edu
|
|
Antimony
|
Flame retardants, batteries
|
China (55%), Russia (20%)
|
China (80%)
|
Refined to trioxide for alloys
|
80% processing
|
Minimal atlanticcouncil.org
|
|
Bismuth
|
Alloys, pharmaceuticals
|
China (70%), Mexico (10%)
|
China (80%)
|
Refined for low-melt alloys
|
80% production
|
Low domestic brookings.edu
|
|
Fluorspar
|
Steel, aluminum, chemicals
|
China (50%), Mexico (20%)
|
China (60%)
|
Acid-grade for HF in manufacturing
|
60% processing
|
~20% domestic crossdockinsights.com
|
Sources: Compiled from USGS, IEA, and DOE data.
China’s overall dominance stems from strategic investments since the 1980s, controlling 60% of rare earth mining and up to 95% for gallium, often through state-backed firms.
The U.S. relies on imports for over 50% of 43 critical minerals, with 100% net reliance on 12, including graphite and gallium.
China’s Control and U.S. Security Measures
China controls an average of 60-80% of global refining for these minerals, leveraging low costs, subsidies, and vertical integration.
Recent actions, such as export restrictions on rare earth technologies (December 2023) and expansions in October 2025 to include five more elements, signal weaponization amid U.S.-China tensions.
This has prompted U.S. responses: The Inflation Reduction Act (IRA) offers tax credits for domestic sourcing, while DOE has invested $60 million in magnet manufacturing and critical materials accelerators.
Executive orders in 2025 mandate immediate increases in domestic production, and initiatives like the Minerals Security Partnership ally with Australia, Canada, and others.
Progress includes new facilities for rare earths in California and lithium in Nevada, but domestic refining remains under 10% for most minerals.
Path to Independence: What Needs to Change and How Fast It Can Happen
Achieving full independence from China is challenging due to geological limits, environmental regulations, and capital needs, but resilience through diversification is feasible. Key changes include:
Streamline Permitting: Reduce mine approval times from 10+ years via reforms like FAST-41 for copper and rare earth projects.
Boost Domestic Refining: Federal initiatives like the Critical Mineral Processing Initiative aim to expand U.S. capacity, targeting 25-50% for key minerals by 2030.
International Partnerships: Invest in allied sources (e.g., Ukraine, Central Asia) and recycling to cut reliance by 20-30%.
R&D and Recycling: Advance alternatives and urban mining to recover 10-20% of needs.
Timeline: Partial resilience (reducing China reliance to <50%) could occur by 2030 for lithium and nickel via IRA-driven projects, but full independence for rare earths and graphite may take 10-15 years, per DOE and Atlantic Council analyses.
Urgent action is needed to avoid disruptions in the energy addition and keep the overall economy moving forward. Since much of this is used in military equipment, the wartime powers act typically comes into effect, and the US invests in mining and companies. We will be watching for investment opportunities.
Got Questions on investing in oil and gas? Or do you have a Tax Burden in 2025?
Crude Oil, LNG, Jet Fuel price quote
ENB Top News
ENB
Energy Dashboard
ENB Podcast
ENB Substack
The post The Current State of Critical Minerals in the US Market appeared first on Energy News Beat.
“}]]